Displaying all posts with the Open Data tag.

Practical Methods for Reducing Urban Tree Mortality

2015_06_22_Street Foliage copy

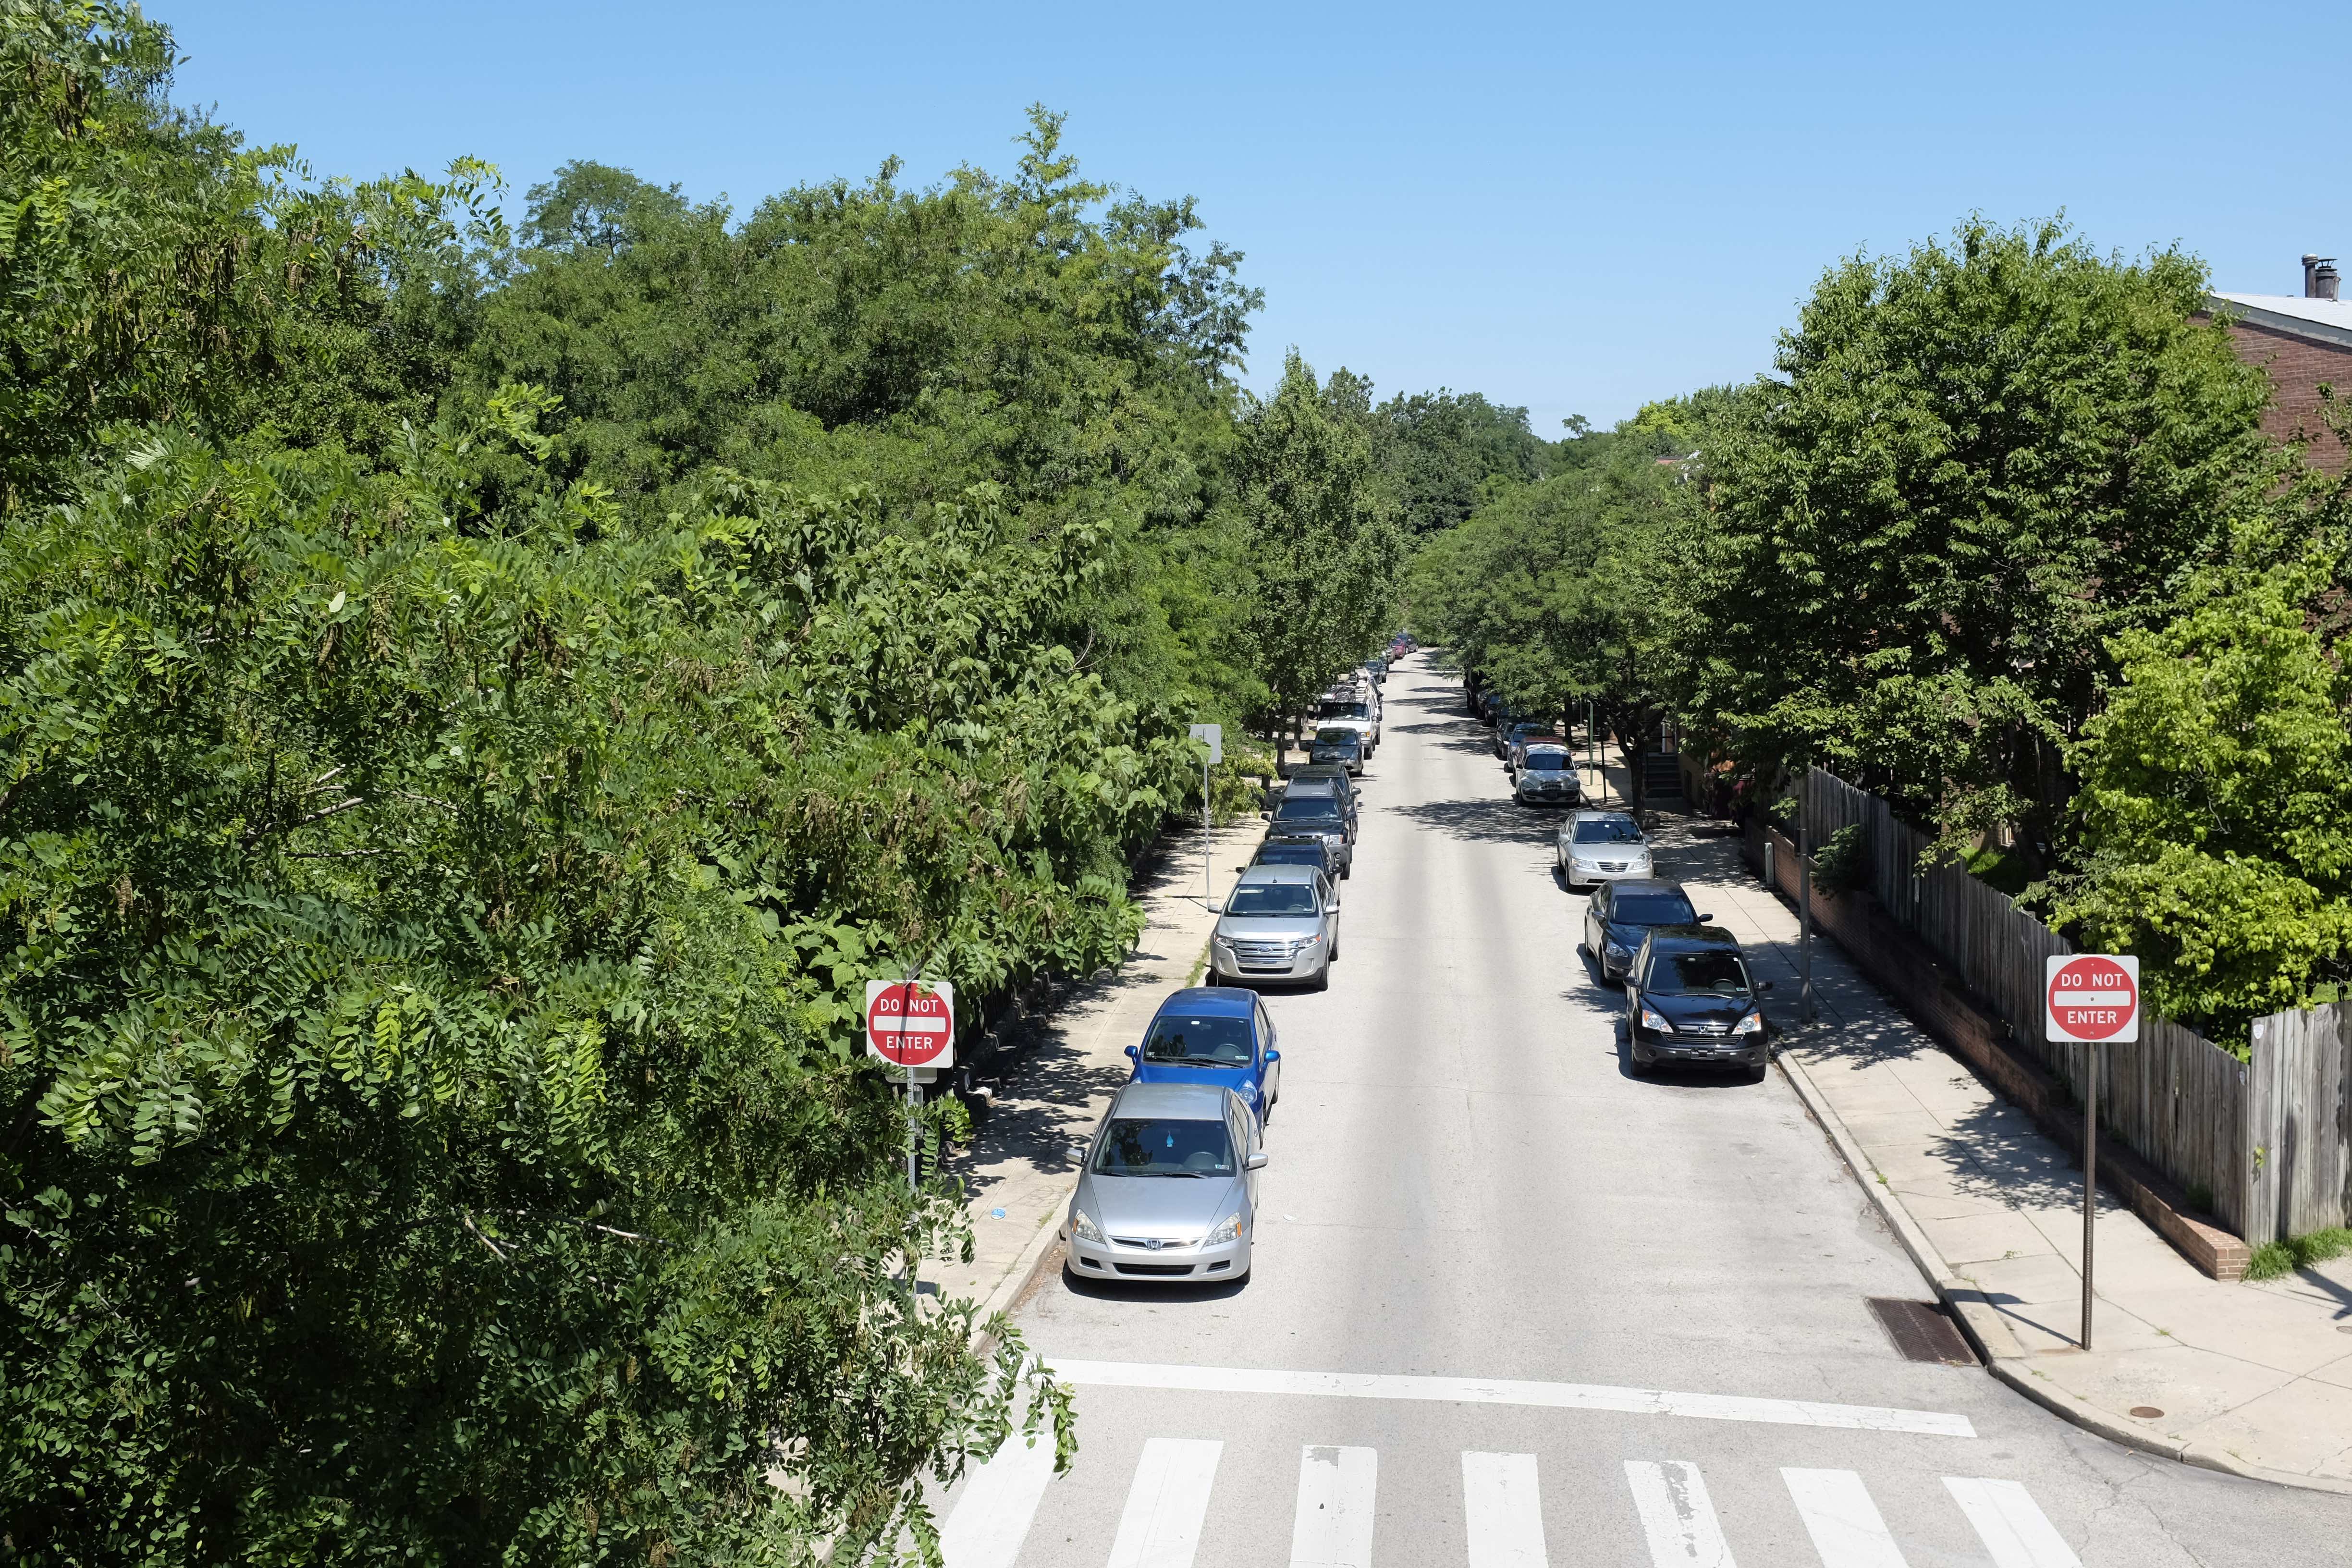
Tree-lined streets like this one in Philadelphia, Pennsylvania cannot be created overnight. Trees must be monitored closely to ensure their long-term survival.

We recently hosted a webinar on practical methods for increasing the annual survival rates of young trees, a topic that is critical to ensuring the longterm growth of our urban forests. Urban forests provide environmental, health, economic benefits that motivate tree-planting programs. However, realizing these ecosystem benefits depends on tree survival. Overall canopy levels in major cities have been declining, and tree planting and regeneration do not offset current losses.

Small, young trees typically have highest mortality rates. However, accurate mortality data is hard to come by and the data that does exist suggests over a quarter of trees planted die within first 5 to 9 years.[1] The lack of available information on mortality rates and causes demonstrates the need for standardized tree monitoring protocol. Collecting and analyzing longitudinal tree data will take years, but to assist in data collection efforts the Urban Tree Growth and Longevity Working Group developed a minimum data set necessary for any urban tree monitoring project. This data set includes field crew information, tree species, location, site type, mortality status, condition rating, and diameter at breast height (DBH).

Technology can be used to support effective, long-term monitoring of urban trees and assist with tree planting and maintenance data processes. Azavea prepared a report titled “Data Management for Urban Tree Monitoring” for the Pennsylvania Horticultural Society (PHS) and the USDA Forest Service on the requirements for ideal software monitoring system. The report is the culmination of over twenty interviews with researchers, practitioners from organizations throughout the US (federal agencies, academic researchers, municipal and nonprofit employees, volunteers, students). Included in the report are in-depth analyses of the software offerings currently on the market and whether they meet the features requirements that allow for successful monitoring.

Data-driven decisions can help you maximize limited resources and advocate for additional funding. Watch the video for more detail on the minimum data set and using technology to ensure the health of your urban forest.

Effective monitoring is not the only solution to increasing the mortality rates of young trees. TreePans, a family-run business based in Iowa, has designed a product that protect trees from mechanical damage and allows for more efficient watering. In the video below, Ben Brown of TreePans discusses the core functionality of the protect, how the implementation of TreePans at one university helped reduce mortality rates, and the importance of providing workers and community members alike with the requisite knowledge and resources for helping care for young trees.

Click here to sign up for future webinars, urban forestry news and product updates.

Recorded Webinar: NYC TreesCount! 2015

Coordinating a street tree census in the biggest city in the United States is exciting and challenging. Jacqueline Lu, the Director of Data Analytics at NYC Parks, discusses how NYC Parks developed and conducted TreesCount! 2015. Deborah Boyer from Azavea describes the software used to gather the data and how digital tools can assist with large-scale urban forestry data collection. We received a lot of great questions during the webinar and have compiled answers to some of the most common questions below.

Is the TreesCount! 2015 software available for other municipalities?

TreesCount! is an open source project and the code is freely available at https://github.com/azavea/nyc-trees. Software development experience will be needed to set up the code, and the mapping process relies on the existence of a file of street block edges for your city or town. For groups without the technical capacity or budget to set up the code, OpenTreeMap may be another solution. OpenTreeMap is a cloud-based platform for helping groups map trees, track stewardship activities, and engage the community around caring for the urban forest. Although it does not include the event management features available in TreesCount!, it does support volunteer mapping as a citizen science initiative.

Why did NYC Parks conduct a volunteer-led tree inventory? Was TreesCount! more expensive than hiring an independent contractor?

NYC Parks’ goal was not simply to collect tree inventory data. From the project’s inception, they also focused on encouraging citizens to engage with the urban forest through the census. If the goal was to get data only, it likely would have been more cost effective to hire contractors to use satellite imagery to plot trees or complete an on-the-ground tree survey. NYC Parks’ focus on citizen engagement was central to the design and functioning of the software Azavea created for them.

Azavea team members volunteering with NYC TreesCount! 2015.

Are ecosystem benefits incorporated into the data?

The TreesCount! software does not calculate ecosystem benefits. After the 2005 census, NYC Parks’ ran the gathered inventory data through the U.S. Forest Service’s iTree Streets (formerly STRATUM) and they plan to complete a similar process with the 2015 data. The software platform for TreesCount! was focused on supporting Parks’ staff, individual volunteers, and partner organizations in their effort to inventory trees. The data was collected so that little manipulation is required for upload into iTree Streets and other analysis tools.

Were there areas that volunteers could not survey due to concerns about personal safety or data quality?

Before sending volunteers into the field, NYC Parks identified block edges where they thought there may be access issues or that would be challenging for volunteers to survey. Challenges included but were not limited to the location of the street, the direction of the street, and the existence of trees in a median. These areas were set aside for volunteers with advanced training or NYC Parks staff. There were also instances where expert surveyors visited a site and determined that the area was too dangerous to survey (example: trees located on a narrow median on a multi-lane street). The project excluded private streets, which fall outside the Parks’ jurisdiction.

How did NYC Parks encourage safety while mapping?

NYC Parks’ encouraged volunteers to map in pairs and groups, and all volunteers wore bright green vests designating them as a volunteer surveyor. Mapping events were often co-sponsored by partner organizations familiar with the area and were generally accessible via public transit.

How did NYC Parks’ deal with naturally occurring or self-seeding trees?

TreesCount! 2015 was explicitly focused on mapping planted street trees located along street block edges. The surveying methodology worked well for single trees along streets and was not as well suited for gathering data on groups of trees that may appear due to natural regeneration.

One of the thousands of blocks volunteers inventoried during TreesCount! 2015.

What does the NYC Parks define as a sign of stewardship?

A sign of stewardship is defined as evidence that a tree received tending or maintenance by someone. This can include tree guards, signs of proper pruning, flowers planted in the tree bed, and mulching. These categories of stewardship were taken from a study NYC Parks completed in 2006 on the effect of stewardship on tree growth and mortality. The study concluded that visible more signs of stewardship for a tree often resulted in greater longevity for that tree, especially when the tree was younger or newly planted.

How were volunteers trained?

Before mapping, all volunteers completed an online training and then received field training from NYC Parks staff or a partner organization. Training materials can be viewed online at https://treescount.nycgovparks.org/static/training/TreesCount2015Training.pdf

Open Data from OpenTreeMap: Visualizing temporal data with CartoDB’s Torque

I just wrote up a meaty Labs post on my idea to visualize tree, species, and user edits over time within exported data from PhillyTreeMap.org, and already covered all the joining, formatting, converting, and uploading necessary to get to this point, along with some simple visualizations at the end. If you haven’t read it, go ahead. I’ll wait here. Because with this post I’m diving straight in to the temporal visualization features of CartoDB’s Torque.

Briefly, though, to reiterate: What are my goals for visualizing the 2 years of PhillyTreeMap user edits over time? I wanted to create something parallel to Mark Headd’s homicide data visualization (also done with Torque) but that told a story over time that was more uplifiting. (What’s more uplifting than trees?) I also hoped my visualization would give us a rough idea of what neighborhoods and areas around Philadelphia have the most active PhillyTreeMap user edits, as well as what times of year seem most active. One could use that knowledge to determine and plan where or when to do outreach about PhillyTreeMap or the programs of our partners, like PHS Tree Tenders. What neighborhoods don’t have many user edits? When does participation drop off? On the flip side, where and when are urban forestry efforts succeeding in engaging the community? A time based spatial visualization can help us answer those questions – and look really cool in the process!


Read more …

Open Data from OpenTreeMap: Visualizing tree data with CartoDB

Update 12:30pm, 8-16-2013: CartoDB is working on a fix for the WKT issues I stumbled upon in this blog and tweeted a workaround. Thanks Javier!

Many months ago, after the City of Philadelphia released some of its Part 1 Crime Incident data on OpenDataPhilly, I read a blog post by our very own Chief Data Officer Mark Headd where he visualized 6 years of homicides in the City of Brotherly Love on a temporal map using CartoDB’s Torque library. While the story the map tells is an important one, it is also depressing and sad – every second, as you watch, more dots appear on your screen representing way too many homicides in our city.

Mark’s map showing locations of homicides over time in Philadelphia. Click the image to see the animation.

I was talking with a friend outside Azavea about Headd’s visualization, and posed a question: “What positive, uplifting change over time in our city could we tell the story of?” I sometimes get the feeling that so much data and visualizations of it are negative or otherwise shock us: from our struggling education system, to stolen bikes, to the disparate impact of voter ID laws. While visualizations like these uncover important stories to tell, so much sad news (for me at least) can sap my motivation to help fix it all. We need to visualize the good and give praise for what’s working, as much as we should analyze the bad and criticize what still needs to be done.

Hearing my frustration, my friend asked, “What about tree plantings or something?”, I assume without even realizing the connection she had just made in my mind.

Of course! That’s it! I happen to work for Azavea, where we craft OpenTreeMap, the best open source public tree inventory software around! I knew I could easily export data from PhillyTreeMap.org for almost two full years worth of ongoing, crowdsourced tree inventory and edits to the map in Philadelphia. We know that having more green, leafy trees and nature around make people happier psychologically, increase property values, clean our air and water, and save electricity and our environment. This was going to be a fun project.

Read more …

Sign Up

Want to Try OpenTreeMap?

Create an account in less than two minutes and get a one-month free trial of OpenTreeMap Cloud. It’s that easy.